

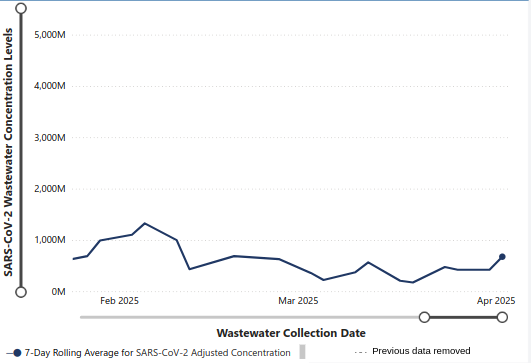
Through 4/9/2025 waste water detection has indicated that COVID has been increasing beyond winter levels in King County.

ALT
Through 4/9/2025 waste water detection has indicated that COVID has been increasing beyond winter levels in King County.
For years, Deputy Mark Hayden sneaked away to look at naked women on his work computer for up to 20 minutes at a time while the County was paying him over $60 an hour.
Investigators found nearly 18,000 images and videos on his computer. He retired before KCSO could fire him.
Hi, it’s the weekly #washingtonstate #kingcounty (that is, #seattle and environs) #COVID #COVID19 #wastewater toots.
A quick reminder that this King County respiratory disease data comes from Washington State, not the federal government.
I usually start with the West Point (WSPT) sewage treatment plant, but the last value in the table, for 4/8, is 0.0. Don't get me wrong, I'd love to live in a world with zeroed-out readings for the Sars-CoV-2 concentration levels were an actual thing! And to be totally fair, the readings from 4/6 are, historically speaking, quite low. But 0.0? I think that's a glitch.
Hardcore wastewater nerds might recall that King County runs their very own Sars-CoV-2 dashboard for the same treatment plants. Alas, the county's dashboard has the same problem. I'm just going to skip WSPT's graph this week.
WSPT is one of three King County(-ish) sewersheds in this dataset. You can find overviews, individual sewershed results, and a breakdown of variants for the state wastewater surveillance program, along with other metrics like case counts and hospitalizations for Covid-19 and other respiratory illnesses, at https://doh.wa.gov/data-and-statistical-reports/diseases-and-chronic-conditions/communicable-disease-surveillance-data/respiratory-illness-data-dashboard#WasteWater. If you go to the page and click "learn more" in the statewide view tab, you can find out lots of details about how these data are calculated and how to interpret them. The dashboard gets updated every Wednesday (generally). The Department of Health is here on the feditubes, at @WADeptHealth.

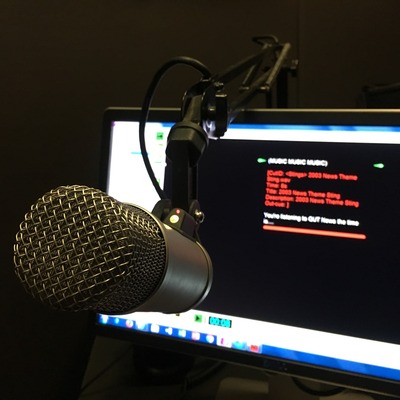
Also listening to music on #AmazonMusic: https://www.amazon.com/music/player
#KingCounty, #Washington #Fire and #Police - South -
https://www.broadcastify.com/webPlayer/40685
#Seattle #Police and #Fire (PSERN) - https://www.broadcastify.com/webPlayer/40212
#Seattle Downtown #Law #Enforcement (#Seattle #Police & WA State Patrol) - (If webpage doesn’t work, try Broadcastify or other police scanner mobile apps)
https://www.broadcastify.com/webPlayer/40168
(3 of 3)
Heads up Seattle area - there is another potential wave of COVID coming through per the waste water data [1].
Be safe out there.
The King County Sheriff’s Office received 702 eviction orders in March, more than twice the 317 orders the agency received in March 2024.
https://www.kuow.org/stories/king-county-judges-processing-crush-of-record-eviction-cases-call-march-numbers-shocking
#KUOW #News #Housing #KingCounty #LawAndCourts

Hi, it’s the weekly #washingtonstate #kingcounty (that is, #seattle and environs) #COVID #COVID19 #wastewater toots.
A quick reminder that this King County respiratory disease data comes from Washington State, not the federal government.
Starting with the West Point (WSPT) sewage treatment plant: last week, the Sars-CoV2 7-day running average headed down. Historically speaking, it's at the lower end of the scale. Last data is from 4/1.
WSPT is one of three King County(-ish) sewersheds in this dataset. You can find overviews, individual sewershed results, and a breakdown of variants for the state wastewater surveillance program, along with other metrics like case counts and hospitalizations for Covid-19 and other respiratory illnesses, at https://doh.wa.gov/data-and-statistical-reports/diseases-and-chronic-conditions/communicable-disease-surveillance-data/respiratory-illness-data-dashboard#WasteWater. If you go to the page and click "learn more" in the statewide view tab, you can find out lots of details about how these data are calculated and how to interpret them. The dashboard gets updated every Wednesday (generally). The Department of Health is here on the feditubes, at @WADeptHealth.

HEY #SEATTLE
The old Bus Tunnel station rail lines need serious work and are gonna be semi-closed for like TEN DAYS IN APRIL, which sounds like a spy novel but is mostly just a pain in the ass:
https://www.soundtransit.org/ride-with-us/1-line-service-disruption
April 14 to April 23, they'll be letting like two trains an hour go through between stations and that's it. Outside the work zone will be normal.
Put it in your calendars!

this is still going by the way
it literally hasn't stopped
the amount of hail keeps going up and down, at its peak it was almost pea-sized
i was not expecting a burst of heavy rain this afternoon but here we are
good thing I got my outside errands sorted out first
Hello, it’s the weekly #washingtonstate #kingcounty (that is, #seattle and environs) #COVID #COVID19 #wastewater toots.
A quick reminder that this King County respiratory disease data comes from Washington State, not the federal government.
Starting with the West Point (WSPT) sewage treatment plant: last week, the Sars-CoV2 7-day running average crept up a bit. Last data is from 3/25.
WSPT is one of three King County(-ish) sewersheds in this dataset. You can find overviews, individual sewershed results, and a breakdown of variants for the state wastewater surveillance program, along with other metrics like case counts and hospitalizations for Covid-19 and other respiratory illnesses, at https://doh.wa.gov/data-and-statistical-reports/diseases-and-chronic-conditions/communicable-disease-surveillance-data/respiratory-illness-data-dashboard#WasteWater. If you go to the page and click "learn more" in the statewide view tab, you can find out lots of details about how these data are calculated and how to interpret them. The dashboard gets updated every Wednesday (generally). The Department of Health is here on the feditubes, at @WADeptHealth.

What is the point of free youth fares if fare enforcement is going to create unnecessary conflicts by even ASKING youth to have a free youth pass?! I don't trust fare enforcement people to not escalate if a teen "disrespects" them. Also a bananas claim that more than a third of riders aren't paying fare which: lol.
https://kingcountymetro.blog/2025/03/24/one-week-countdown-king-county-metro-restarts-fare-enforcement-march-31/ #seattle #KingCountyMetro #KingCounty #transit

Hello, it’s the (delayed this week -- sorry!) weekly #washingtonstate #kingcounty (that is, #seattle and environs) #COVID #COVID19 #wastewater toots.
A quick reminder that this King County respiratory disease data comes from Washington State, not the federal government.
Starting with the West Point (WSPT) sewage treatment plant: last week, the Sars-CoV2 7-day running average crept up a bit, though it is still at the low end of the scale, historically speaking. Last data is from 3/18.
WSPT is one of three King County(-ish) sewersheds in this dataset. You can find overviews, individual sewershed results, and a breakdown of variants for the state wastewater surveillance program, along with other metrics like case counts and hospitalizations for Covid-19 and other respiratory illnesses, at https://doh.wa.gov/data-and-statistical-reports/diseases-and-chronic-conditions/communicable-disease-surveillance-data/respiratory-illness-data-dashboard#WasteWater. If you go to the page and click "learn more" in the statewide view tab, you can find out lots of details about how these data are calculated and how to interpret them. The dashboard gets updated every Wednesday (generally). The WA Department of Health is here on the feditubes at @WADeptHealth.

Describing the moment as “bittersweet,” Constantine reflected on how the county has evolved since he took office in 2009.
https://www.kuow.org/stories/king-county-dow-constantine-delivers-final-state-of-the-county-address
#KUOW #News #KingCounty #Politics

The King County executive just got hired as CEO of Sound Transit with a salary of $450k in an opaque process. He sits on the board of Sound Transit. If you are angry at the cronyism and corruption in the Trump administration remember that this behavior is how it got normalized.
https://www.kuow.org/stories/dow-constantine-nominated-to-be-next-sound-transit-ceo

For reasons I looked up the statutes that make urinating or defecating in public illegal in here (#washington #kingcounty #seattle). Looking them up reminds me that dogs have more rights than humans, at least as far as public poop.
I suspected there was another spike because I got sick, yet again, for the 4th since the beginning of winter.
I don't know if it is covid, but its similar to previous confirmed infections.
I do live with a pre-schooler, which doesn't help, but I've also been going to coffee shops to work a lot since they started school, rather than driving home after drop-off.
I think I'm just going to go to the library to work instead, and bring my caffeine from home.

Hello, it’s the weekly #washingtonstate #kingcounty (that is, #seattle and environs) #COVID #COVID19 #wastewater toots.
A quick reminder that this King County respiratory disease data comes from Washington State, not the federal government.
Let's start with the West Point (WSPT) sewage treatment plant. The Sars-CoV2 7-day running average was modestly down this week. Last data is from 3/9.
WSPT is one of three King County(-ish) sewersheds in this dataset. You can find overviews, individual sewershed results, and a breakdown of variants for the state wastewater surveillance program, along with other metrics like case counts and hospitalizations for Covid-19 and other respiratory illnesses, at https://doh.wa.gov/data-and-statistical-reports/diseases-and-chronic-conditions/communicable-disease-surveillance-data/respiratory-illness-data-dashboard#WasteWater. If you go to the page and click "learn more" in the statewide view tab, you can find out lots of details about how these data are calculated and how to interpret them. The dashboard gets updated every Wednesday (generally). New! the Department of Health is here on the fedweb, at @WADeptHealth